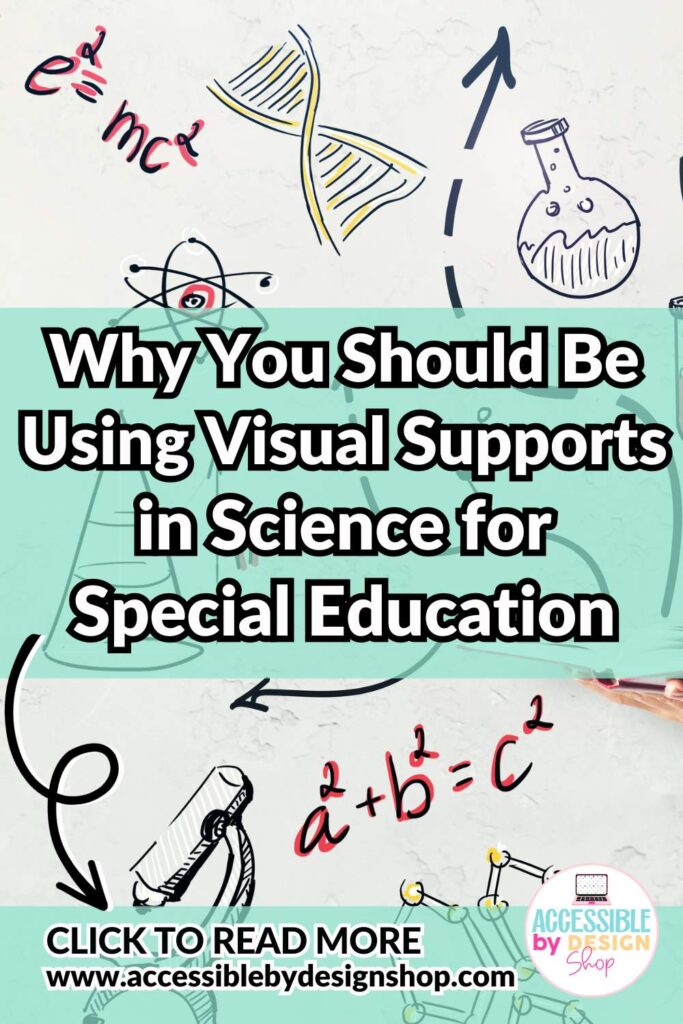
Using Visual Supports in Special Education Science Class
A picture is worth a thousand words. Isn’t that how the saying goes? And it’s true! An accurate visual can be more effective than all the verbal or written explanations in the world. This is especially accurate for special education teachers who teach science class.
Complex scientific concepts can be challenging for students with diverse learning needs. Visual supports can therefore make science more accessible for special education students.
Using visuals such as charts and graphs is great, but incorporating color, icons, arrows, and labels can be even more helpful. These aspects can help to break down complex topics into manageable parts. And these manageable parts can meet the accommodations for various special needs.
The Power of Visual Supports
Visual supports include various tools that incorporate visual elements such as charts, graphs, pictures, schedules, diagrams, and infographics. Notably, these have little to no text included so the focus is on a clear visual representation.
These supports are valuable in the classroom, particularly a science classroom because visuals can simplify abstract and complex scientific ideas.
Visuals can help to represent processes that students cannot experience or study up close. For example, a diagram of a cell or the process of photosynthesis.
Furthermore, visuals in science are also effective in the learning process for all students.
Research from scholars such as Dr. Lynell Burmark, Dr. M. Kragten, and countless others advocate for the inclusion of visuals in all disciplines since it often means students can make meaning, understand better, and retain the information longer. Studies have found that students who learned with the inclusion of appropriate visuals were substantially more likely to remember material three days later than those who took notes or listened lecture-style.
Designing Effective Visual Supports
When creating or sourcing visual supports that can be effective in your lesson plans there are many elements to consider. Here are three of the most important to consider:
- Font – both size and type. If you’re creating your own, stick with simple, sans-serif fonts (those are fonts without the fancy tails and squiggles) such as Arial, Helvetica, or Courier.
There’s even a specific font that has been developed called Open Dyslexic, which you can download and install free from this site. The font features letters with heavy-weight bottoms that indicate direction.
For font size a default of 12-14 point is ideal, but you can adjust for your students’ needs.
- Color. There are lots of theories about color use and the brain. Contrasts between colors can cause visual strain. This site is an amazing option that lets you test what might work best as a combination. For some students a light color font on a dark background is best, for others, printing on green paper helps with eye strain and visualization.
- Simplicity in design. Think about the ways in which the visual can be most impactful. Often that involves simplicity in the use of text and images and good spacing – white space on a page lets the eye rest.
If you’re creating your own visuals, I love Canva. It’s free to teachers and their students and it includes a wide array of options for ready-made templates. Plus, it’s user-friendly for those with little to no experience with design software.
Another option to make free online infographics is infogram.com. There is a free option that limits the number of creations but it can still be useful. There is a bit of a learning curve in designing on the platform but there are some already-created options that could be useful in a science class.
Integrating Visuals into Science Lessons
Adding visuals to your science lessons can be done seamlessly. But there is a need for some consistency in using visuals throughout your curriculum since it helps students know what to expect, means its something less for them to adjust to, and provides reliability for your lessons.
Here are some of my favorite lesson plan ideas that incorporate visuals for different topics:

This Forms of Energy Adapted Book is engaging and interactive. Use it to teach special education students new facts and concepts about forms of energy including light energy, sound energy, and heat energy. Students read and then match the images on the final page (via cut & pasting or laminating & velcro) to the page they have read.

Forms of energy is an essential science curriculum concept – it can especially be tricky to teach in special education. This 10 Day Mini Unit breaks down forms of energy into clear, repeated practice in varying formats. With definition posters, reading passages, comprehension questions, and worksheets, students will reinforce their understanding of forms of energy in engaging and varied formats that include integrated visuals!

If you’re not already using BOOM Learning™ this is a good option to start with your students! This boom deck features 30 self-grading cards asking students to look at an image and determine whether it is heat energy, light energy, or sound energy. Get instant data collection for your special education science students when they complete your boom decks!
Grab the MEGA bundle and save!

If you want to save time and money (and who doesn’t!), then check out this Forms of Energy Mega Unit BUNDLE. It features the resources listed above along with everything you need to teach the concepts so your students engage with the materials and understand the content. With best-selling resources like my Forms of Energy 30 Day Unit Pack, Forms of Energy 10 Day Unit Pack, Forms of Energy Adapted Book, Forms of Energy Worksheets, and more, your students will master forms of energy in a way that is accessible to them in no time!
Take-aways: visual supports in science class
When teaching science students often struggle to ‘see’ the lesson. While we’d love to incorporate hands-on experiential elements such as labs as often as we can, they can often be a challenge with time and money.
Another way to make science clear to students is to integrate the right visual supports for any lesson in your science class. Visual aids can be a powerful tool for enhancing science education for all students.